Disclaimer
This article is not a comprehensive performance analysis of Sony UX1XRN. The goal is to find a comparable PC configuration for gaming. And we will mostly compare performances of CPUs and GPUs.
Testing methodology
The following programs were used to test CPU and Memory performance:
- SiSoft Sandra version 2001.0.7.10;
- PassMark Performance Test 8.0 build 1054;
- PCMark 2002 build 100;
- Unreal Tournament version 436.
- Settings: software rendering, resolution: 800×600, color depth: 32 bit, graphics level: high; demo file – UTBench.
- Metric: Avg FPS.
The following programs were used to test Direct3D performance:
- 3DMark2000, version 1.1, build 340. Settings: default values except color depth and resolution (mentioned in the results below);
- 3DMark2001 SE, build 330. Settings: default values except screen resolution (mentioned in the results below).
The following programs were used to test OpenGL performance:
- Quake III: Arena version 1.32c. Settings: color depth (32 bit), various resolutions (mentioned in the results below).
All tests performed after suitable warm-up period.
Setup #1 description
Device: Sony VAIO VGN-UX1XRN
CPU #1 (original): Intel® Core™ Solo U1500
CPU #2 (resoldered): Intel® Core™2 Duo U7700
BIOS version: R0101N2
OS: Windows XP Professional SP3 5.1.2600
Intel GMA driver version: 6.14.10.4926
This device has been tested with two versions of CPU:
- The original CPU from the manufacturer – Intel® Core™ Solo U1500 (32-bit, single-core, 1.33 Ghz);
- The manually resoldered CPU – Intel® Core™2 Duo U7700 (64-bit, dual-core, 1.33 Ghz).
Default GPU clock rate in UX1XRN is lower than it’s "true" value (400 Mhz, according to the specifications). In order to achieve maximum 3D performance I used GMABooser version 2.1. Technically I would not call this overclocking, because we don’t exceed the clock rate and voltage values from the chip specifications.
Thus all 3D benchmarks on UX1XRN were performed twice: with default GPU clock rate and with GPU clocked at 400Mhz.
Setup #2 description
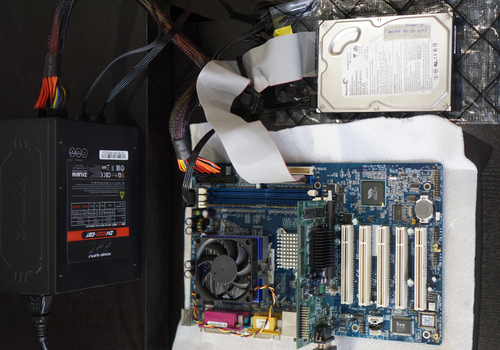
Motherboard: Shuttle AK38N V1.1, BIOS AK38S003
RAM: Samsung M312L2923CZ3-CB3 1Gb DDR PC2700 CL2.5 ECC
CPU: AMD Athlon XP 1800+ 1,54Ghz (used in all benchmarks), AMD Athlon XP 1500+ 1,33Ghz (used only in CPU benchmarks)
PSU: Zalman ZM1000-EBT
OS: Windows XP Professional SP3 5.1.2600
In order to find a comparable discrete PC video card I used seven cards based on
Nvidia chips:
- Inno3D MX(200) 64MB Nvidia GeForce2 MX200 Core@176Mhz, Memory@166Mhz 64bit;
- NoName 32M Nvidia GeForce2 MX400 Core@200Mhz, Memory@150Mhz 128bit;
- SUMA Platinum 32M Nvidia GeForce2 MX400 Core@200Mhz, Memory@183Mhz 128bit
- ASUS V7100 Pro 64M Nvidia GeForce2 MX400 Core@200Mhz, Memory@333Mhz 64bit;
- ASUS V8170MAGIC/64M Rev. 3.0 Nvidia GeForce4 MX420 Core@250Mhz, Memory@333Mhz 128bit;
- NoName 64M Nvidia GeForce4 Ti 4200 Core@250Mhz, Memory@513Mhz.
- ASUS V9520/TD Rev. 1.02 128M Nvidia GeForce FX5200 Core@250Mhz, Memory@405Mhz;

Nvidia drivers version (same for all test samples): 93.71
CPU & Memory performance
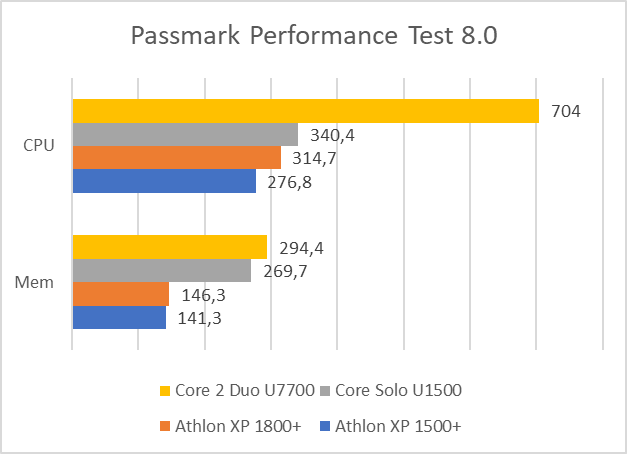
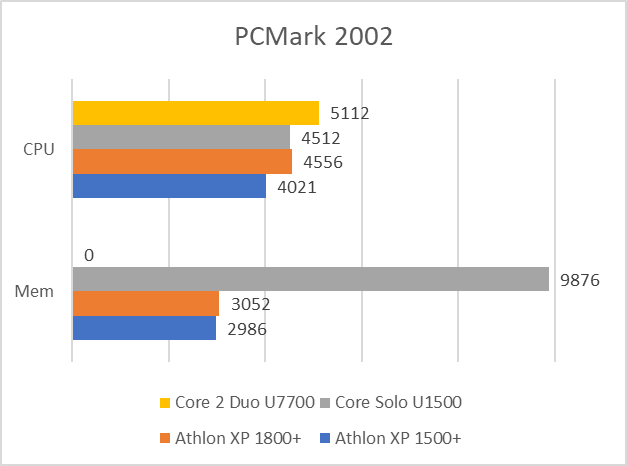
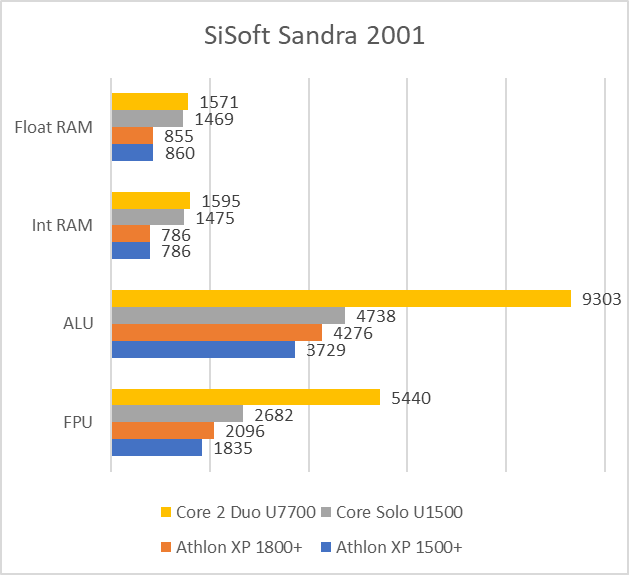
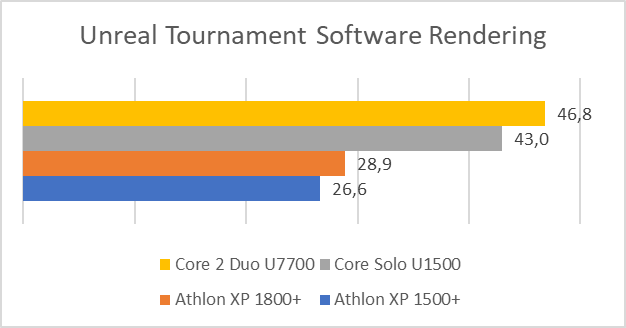
AMD K7 architecture was a substantial breakthrough, which provided higher performance per Mhz than we had with Intel’s Pentium processors. Taking that fact into account, I was doubt, whether a mobile processor Core Solo U1500 is able to compete with AMD K7 at the same clock rate. As we can see now, U1500 has actually much higher performance per Mhz. In all test scenarios except one (PCMark CPU test) U1500 (which is clocked at 1,33Ghz) scores even higher than 1,54Ghz AMD K7. PCMark CPU test results are practically equal.
There is also significant difference in memory performance. Memory in UX (DDR2 400Mhz) is approximately two times faster than DDR 333.
U1500 shows outstanding results in the UT software rendering. I supposed that the drastic difference is caused by RAM. So I replaced DDR 333 with DDR 400 (NCPD6AUDR-50M26) in the PC setup and ran benchmark one more time. The result with DDR 400 was even more frustrating: 28,6 fps.
Core2 Duo U7700 is actually 2 times faster than U1500 when the test program utilizes both cores.
PCMark has failed to run the tests on Core2 Duo U7700 (the program crashes all the time).
Since Athlon 1500+ is significantly slower than Core Solo U1500, I decided to use the Athlon 1800+ in all 3D performance benchmarks.
3D performance
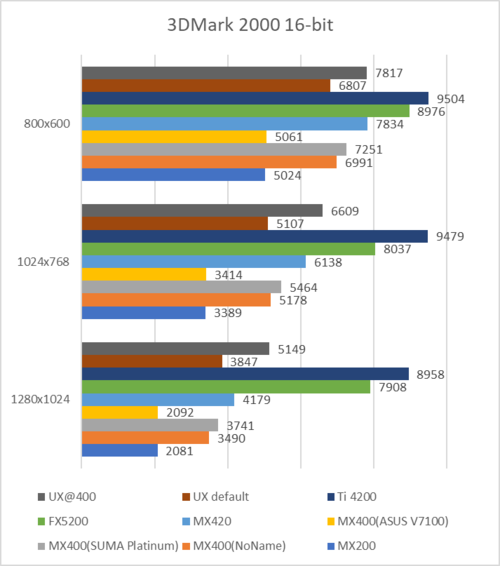
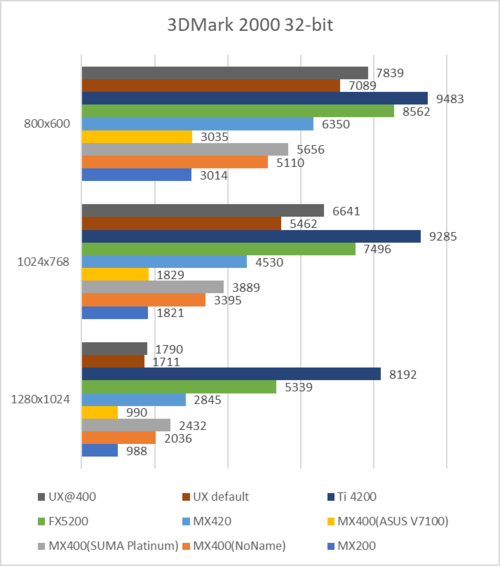
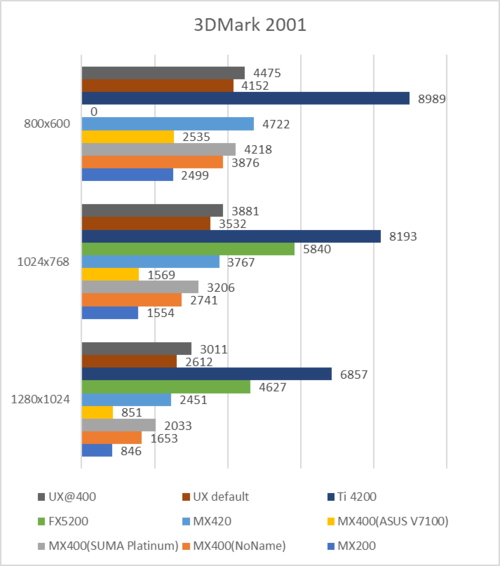
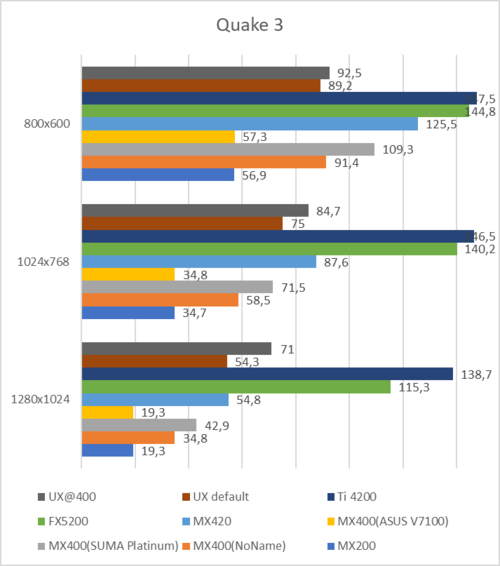
According to the results, GMA performance is somewhere in between the fastest version of MX400 (SUMA Platinum) and the MX420.
GMA 950 at default GPU clock rate scores closer to
- MX420: in 5 tests;
- MX400: in 7 tests.
GMA 950 clocked at 400Mhz GPU is closer to
- MX420: in 10 tests;
- MX400: in 2 tests.
The fastest version of MX400 is the closest PC alternative to GMA 950 running in UX1XRN at default clock rate. But when we boost GMA 950 to 400Mhz, the MX420 becomes the closest PC alternative.
Power consumption

I was curious what’s the actual power consumption of the devices. UX1XRN consumes significantly more power than I expected.
Sony UX works fine with dual-core 10W CPU. The CPU replacement increases the consumption of the device by only a quarter.
Conclusion
Athlon XP 1800+ with GeForce2 MX400 is quite close to Sony UX1XRN in terms of CPU and 3D performance. Boosting GMA 950 up to 400Mhz makes it a bit faster. In this case the GPU runs approximately as good as GeForce4 MX420.

