Introduction
"An ultra-mobile PC (ultra-mobile personal computer or UMPC) is a miniature version of a pen computer, a class of laptop whose specifications were launched by Microsoft and Intel in spring 2006." (c) Wikipedia. That was the dawn of the first UMPC epoch. This epoch did not last too long, because in the early 2010s major UMPC manufacturers ended its product lines. Few years later new manufacturers emerged and recreated UMPC market. The major one was the Chinese company GPD. GPD started the second UMPC epoch by releasing gaming handheld GPD Win in 2016 and the general purpose device GPD Pocket in 2017. Since then a whole bunch of UMPC devices were released. In this article, we compare the performance of various UMPC devices from the second epoch, ranging from the very first GPD Win to the most powerful clamshell to date—the GPD Win Mini 2025. In total, 12 different devices will be examined in this comparison.

Disclaimer. This article is not a comprehensive performance analysis of the 2-nd era UMPCs. All the test items are taken from my collection. Therefore the number of test items is quite limited. In case I add any new corresponding items to my collection, this benchmark survey might be extended as well.
Performance testing tools
The following programs were used to test CPU, Memory, Disk performance:
- Geekbench version 5.3.1;
- PassMark Performance Test 10.0 build 1010;
- CrystalDiskMark version 8.0.1;
- CPU-Z version 1.95;
- AIDA64 version 7.50.7200;
The following programs were used to test 3D performance:
3DMark with default settings. Version details:
- Time Spy version 1.2
- Fire Strike version 1.1
- Wild Life version 1.0
- Port Royal version 1.4
Unigine Heaven Benchmark at the resolution of 1280×720; version 4.0.
Test setup descriptions
GPD Pocket
Processor: Intel Atom x7-Z8750
RAM: 8Gb LPDDR3 1069Mhz
BIOS version: AMI 5.11 8/7/2017
OS: Windows 10 Professional Version 10.0.18363 Build 18363
Intel HD Graphics 405 driver version: 20.19.15.4444
GPD Pocket 3
Processor: Intel Core™ i3-1125G4
RAM: 16Gb LPDDR4 3733Mhz
SSD: WD_BLACK SN850X 2000GB 2Tb
BIOS version: AMI 2.22.1282 02/25/2025
OS: Windows 11 Professional Version 24H2 build 26100.2033
Intel UHD Graphics driver version: 31.0.101.4672
GPD Win
Processor: Intel Atom x7-Z8750
RAM: 4Gb LPDDR3 1069Mhz
SSD: EMMC Samsung CGND3G 64Gb
BIOS version: AMI 5.11, 25.05.2017
OS: Windows 10 Professional Version 10.0.18363 Build 18363
Intel HD Graphics 405 driver version: 20.19.15.4549
GPD MicroPC
CPU: Intel Celeron N4100
RAM: 8Gb LPDDR3 2133Mhz
SSD: TS256GMTS400S 256Gb
BIOS version: AMI 02.07.2019
OS: Windows 10 Professional Version 10.0.17763 Build 17763
Intel UHD Graphics 600 driver version: 26.20.100.7584
TDP: 10W
One-Netbook A1
Processor: Intel Core m3-8100Y
RAM: 8Gb DDR4 1600Mhz
SSD: Sabrent Rocket nano 1Tb
BIOS version: AMI 5.12 12.09.2020
OS: Windows 10 Professional Version 10.0.19042 Build 19042
Intel UHD Graphics 615 driver version: 27.20.100.8681
One-Netbook OneMix 2s
Processor: Intel Core m3-8100Y
RAM: 8Gb LPDDR3 1600Mhz
SSD: FORESEE 256GB 256Gb
BIOS version: AMI 5.12 04.03.2019
OS: Windows 10 Professional Version 10.0.19042 Build 19042
Intel UHD Graphics 600 driver version: 26.20.100.7584
Noname P8 N100
Processor: Intel N100
RAM: 12Gb LPDDR5 4800Mhz
SSD: The default model is SK800-128GB, which exhibits very limited performance (read speed of 467 MB/s and write speed of 460 MB/s). Therefore, the SSD was replaced with a significantly more capable model – Netac 1TB N930ES NT01N930ES-001T-E2X. The benchmark results shown in the diagrams below are for this upgraded model.
BIOS version: 5.25 MH-ADL81 1.08 x64
OS: Windows 10 Pro Version 22H2 Build 19045.5131
Intel UHD Graphics driver version: 32.0.101.6129
Noname P8 N150
Processor: Intel N150
RAM: 12Gb LPDDR5 4800Mhz
SSD: This unit was purchased without an included SSD. A Viper VP4000M 1TB drive was installed.
BIOS version: 5.27 EC FW Version V304
OS: Windows 11 Pro Version 24H2 Build 26100.2033
Intel UHD Graphics driver version: 32.0.101.5813
One-Netbook OneGx1 Pro i7
Processor: Intel Core i7-1160G7
RAM: 16Gb LPDDR4 4267Mhz
SSD: One-Netbook PCI-E 512G SSD
BIOS version: AMI 5.19 17.12.2020
OS: Windows 10 Professional Version 10.0.19042 Build 19042
Intel Iris Xe Graphics driver version: 27.20.100.8680
One-Netbook OneGx1 Pro i3
Processor: Intel Core i3-1110G4
RAM: 16Gb LPDDR4 4267Mhz
SSD: One-Netbook PCI-E 512G SSD
BIOS version: AMI 5.19 2.21.1278
OS: Windows 10 Professional Version 22H2 Build 19045.4529
Intel UHD Graphics driver version: 32.0.101.6325
GPD Win Mini 2024
Processor: AMD Ryzen™ 7 8840U @28W
RAM: 32Gb LPDDR5 7500Mhz
BIOS version: MiniEDP 1.66 x64
OS: Windows 11 Home 23H2 Build 22631.4602
AMD GPU driver version: 24.12.1
GPD Win Mini 2025
Processor: AMD Ryzen™ AI 9 HX 370 @35W
RAM: 64Gb LPDDR5 8000Mhz
SSD: WD PC SN740 SDDPNQE-2T00 2Tb
BIOS version: MiniPro 2.10 x64
OS: Windows 11 Home 25H2 Build 26200.7462
AMD GPU driver version: 25.12.1
CPU & Memory performance


Single-core processor performance continues to grow, but the rate of growth is quite modest. However, total multi-threaded performance has increased 20-fold over the last 9 years!
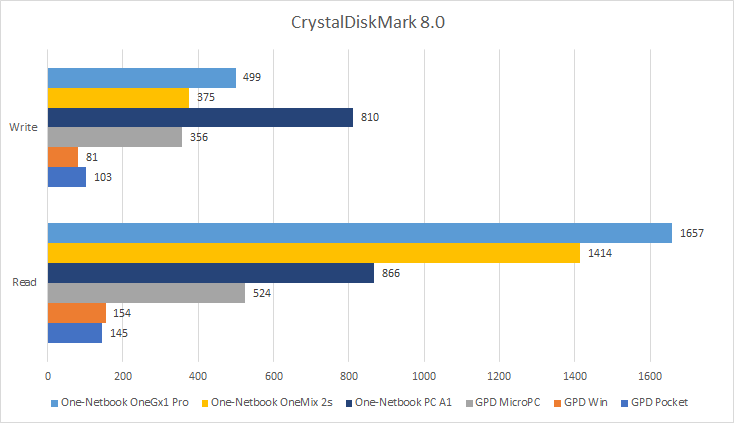
SSD performance

Storage read and write speeds of have increased tens of times over the last 9 years. However, the highest performance is demonstrated not by the GPD Win Mini 2025, but by the GPD Pocket 3. The latter features an incredible read speed of 6 GB/s. It is possible that the storage performance of the GPD Win Mini 2025 could be improved by replacing the drive.
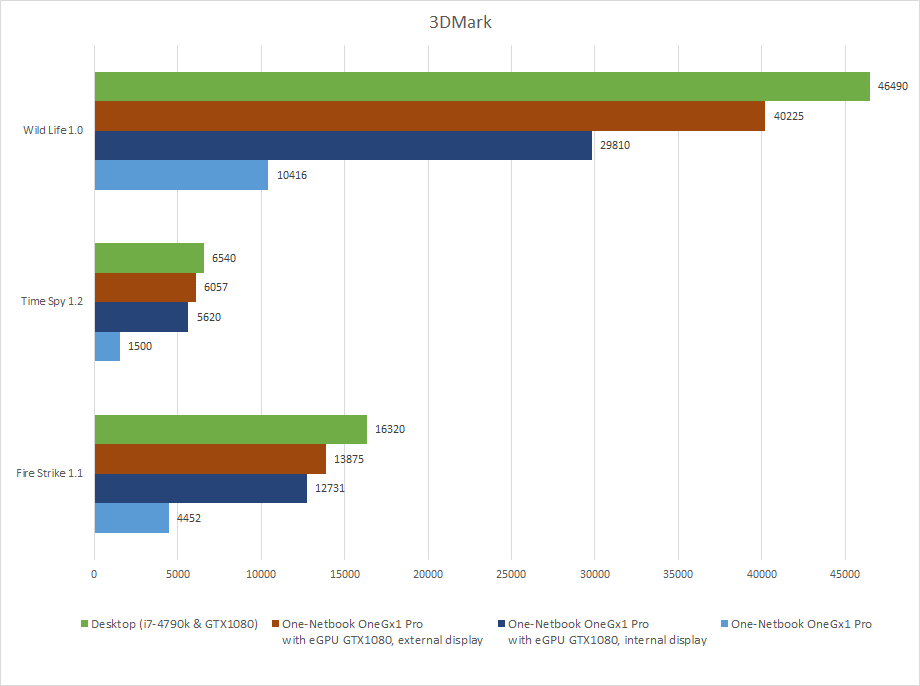
3D performance


Few notes:
- Performance of Iris Xe (One-Netbook OneGx1 Pro i7) was just outstanding as of 2021.
- The performance of the Radeon 890M (GPD Win Mini 2025) has doubled compared to the Iris Xe.
- Tiger Lake supports Thunderbolt 4, which allows to connect eGPU to the UMPC. eGPU can improve 3D performance of OneGx1 Pro by at least 4 times. See details here: Benchmarking OneGx1 Pro with eGPU.
- Performance of A1 is significantly lower than performance of OneMix 2s, which is based on the same Intel Core m3-8100Y.
- Despite the similar brand name "UHD Graphics", the GPU performance in the i3-1110G4 is 2+ times higher than the performance of the m3-8100Y and N100.
- Despite the Intel N150’s relatively modest performance compared to flagship devices, it is worth noting that the N150 is noticeably more performant in 3D than the Intel N100.
Conclusion
Since the GPD Win (released in 2016) performance of UMPCs for 2025 has changed as follows:
- CPU performance in single-threaded mode has increased by about 9 times and has not grown significantly in the last 3 years.
- CPU performance in multithreaded mode has increased by about 20 times and has roughly doubled over the past 3 years.
- RAM also demonstrates impressive performance growth—a 10-fold increase over 9 years.
- SSD read speed has increased 40-fold, while write speed has increased nearly 60-fold.
- GPU performance increased by about 35-40 times, depending on the task.